Candlestick charts are one of the most popular tools for forex traders. They provide a visual representation of price action and help traders make predictions about future price movements.
In this article, we’ll introduce you to some of the most commonly used candlestick patterns and how they can help guide your trading decisions.
📌 1. Doji Candlestick
What it is:
A Doji candlestick forms when the open and close prices are nearly identical. It looks like a cross or plus sign.
Interpretation:
- A Doji indicates indecision in the market, where neither the buyers nor sellers can dominate.
- It often signals a potential reversal or a pause in the current trend.
Key types of Doji:
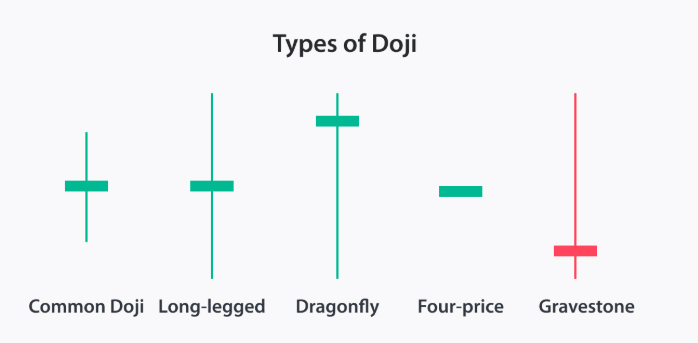
- Standard/Common Doji: The open and close are very close.
- Long-Legged Doji: Shows more price movement, indicating uncertainty.
- Gravestone Doji: The close is at or near the low, showing a potential reversal to the downside.
- Dragonfly Doji: The close is at or near the high, signaling a possible reversal to the upside.
- Four-price: This is a candle with open, high, low, and close prices at the same levels. This rarely occurs on price charts and indicates a high level of market indecision. Traders may find it in low-volume markets.
✅ Best for: Spotting trend reversals or indecision points in the market.
📌 2. Engulfing Pattern
What it is:
The Engulfing Pattern consists of two candlesticks:
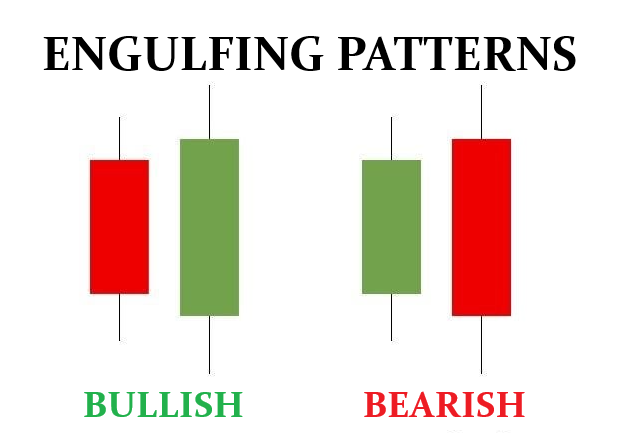
- A smaller candlestick followed by a larger opposite-colored candlestick.
- Bullish Engulfing: The second (larger) candle is bullish (green) and completely engulfs the first (smaller) bearish candle.
- Bearish Engulfing: The second (larger) candle is bearish (red) and completely engulfs the first (smaller) bullish candle.
Interpretation:
- Bullish Engulfing: Suggests the potential for an upward trend or reversal from a downtrend.
- Bearish Engulfing: Indicates the potential for a downward trend or reversal from an uptrend.
✅ Best for: Identifying trend reversals, especially after prolonged price moves.
📌 3. Hammer and Hanging Man
What it is:
Both Hammer and Hanging Man look like an inverted “T” with a small body at the top and a long wick at the bottom.
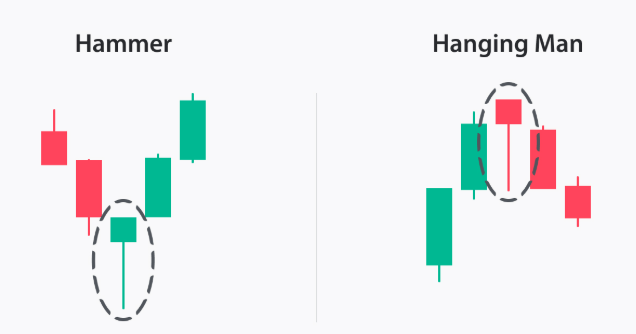
- Hammer: Forms at the bottom of a downtrend, signaling a possible reversal to the upside.
- Hanging Man: Forms at the top of an uptrend, indicating a potential reversal to the downside.
Interpretation:
- Hammer: The long lower shadow indicates that buyers rejected lower prices, suggesting a potential bullish reversal.
- Hanging Man: The long lower shadow shows that sellers rejected higher prices, potentially signaling bearish reversal.
✅ Best for: Spotting potential trend reversals, especially after strong moves in the opposite direction.
📌 4. Morning Star and Evening Star
What it is:
These are three-candle patterns that signify a trend reversal:
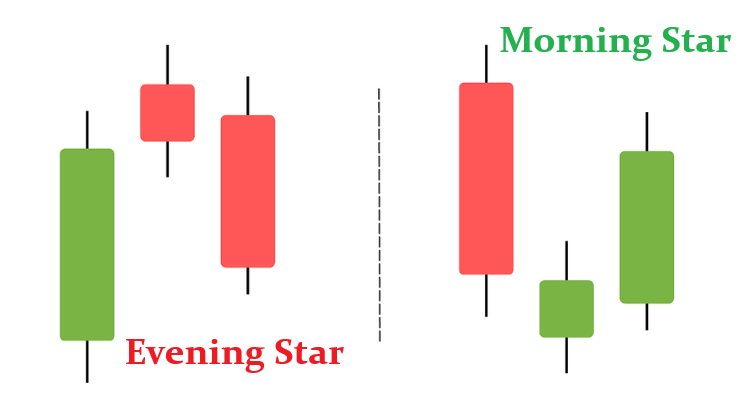
- Morning Star: A bullish reversal pattern that appears at the bottom of a downtrend.
- A bearish candle followed by a small candle (can be bullish or bearish) and then a bullish candle.
- Evening Star: A bearish reversal pattern that appears at the top of an uptrend.
- A bullish candle followed by a small candle and then a bearish candle.
Interpretation:
- Morning Star: Indicates a bullish reversal and the potential end of a downtrend.
- Evening Star: Signals a bearish reversal and the potential end of an uptrend.
✅ Best for: Identifying clear trend reversals, especially in long-term trends.
📌 5. Shooting Star
What it is:
A Shooting Star is a single candlestick with a small body at the bottom and a long upper wick.
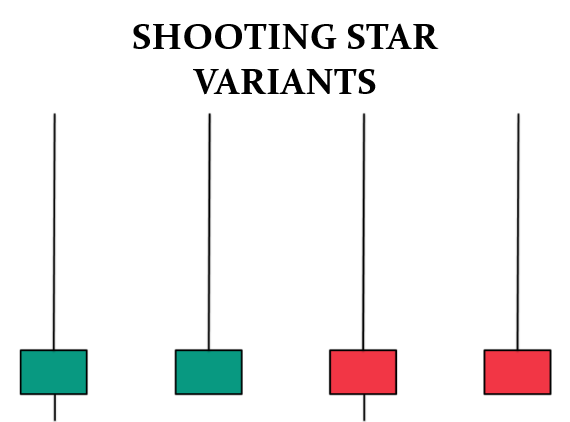
Interpretation:
- Forms at the top of an uptrend, signaling that buyers tried to push the price higher, but sellers took control, driving the price back down.
- The long upper wick indicates a failed attempt to continue the trend, signaling a potential bearish reversal.
✅ Best for: Spotting potential tops in an uptrend and possible bearish reversals.
🧾 Summary of Key Candlestick Patterns
| Pattern | Formation | Indicates | Best For |
|---|---|---|---|
| Doji | Open and close prices are nearly identical | Indecision or potential reversal | Identifying trend pauses or reversals |
| Engulfing | A larger candlestick engulfs a smaller one | Reversal (bullish or bearish) | Spotting trend reversals |
| Hammer/Hanging Man | Small body at the top, long wick at the bottom | Reversal signal (up or down) | Identifying reversal at trend ends |
| Morning Star/Evening Star | Three-candle pattern | Trend reversal (bullish or bearish) | Identifying trend changes |
| Shooting Star | Small body, long upper wick | Reversal from an uptrend to a downtrend | Identifying potential market tops |
🧠 Final Thoughts
Candlestick patterns are a powerful tool for forex traders. By learning to recognize key patterns like Doji, Engulfing, Hammer, and others, you can gain valuable insights into potential market reversals or continuations.
👉 Pro Tip: Always combine candlestick patterns with other indicators, such as RSI or moving averages, for stronger confirmation before entering a trade.
📘 What’s Next?
👉 LESSON 8: Basic Technical Indicators: RSI, MACD, Moving Averages & More
Ready to dive deeper into candlestick analysis? Learn about more advanced patterns and how to use them in your forex trading strategy.